Newsletter List


Newsletter Issue #79, September 2006

ICAP/4 8.x.11 Build 2817 Enhancements
Operating Point Labels

Intusoft's latest ICAP/4 software release, 8.x.11 Build 2817, greatly refines existing features to make the software even easier to use, plus adds a powerful Digital Data Viewer to IntuScope.

In the previous release we added the ability to display current and power Operating Point labels directly on the schematic instead of just voltage. All OP labels were blue with either "V," "A" or "W" unit suffixes used to distinguish between voltage, current, and power. Based on user requests, the ability to define individual colors for each type of OP label has been added. Go to Options > Drawing Item Colors… and select the OP Labels tab. The default colors are blue, red, and green for voltage, current, and power OP labels respectively.

In This Issue
1 New Enhancements for:
OP labels
2 Parts Bin Editor
4 Crossprobe Thumbnail Graphs
5

Monte Carlo

5

Results Dialog and Report File

6 Removed Select Limits and Expanded Others
6 More SpiceNet Enhancements
7 IsEd5
9 Improved IntuScope
9 ICAP/4's new Digital Data Viewer
15 Power Systems World Electronics Convention

Also in the previous release we added the ability for the OP labels to retain their position after they were refreshed. This saved time from having to reposition many OP labels back to a desired location after trying to refresh the OP values. The problem was when users moved a block of circuitry; the OP labels would stay in their previous place. In this release the ability for the OP labels to keep a relative position to their source was added. This means that when you move resistor R1, for example, its i(r1) and p(r1) OP labels will move with the part. Further, if too much clutter is created with a large amount of OP labels, simply click on the refresh OP labels button to highlight all OP labels, then press the Backspace keyboard button to delete them. When you refresh the OP labels again, they will be placed in their default positions next to their sources. These new OP labels require a new file type so they will be removed if you save as an earlier file version. Earlier versions of ICAP/4 will not be able to open DWG files that include these types of OP labels.

Figure 1:
Here are the before and after pictorials of a RLC circuit where select parts were dragged leftward. Notice that the OP labels keep their relative position with respect to their source.
Parts Bin Editor

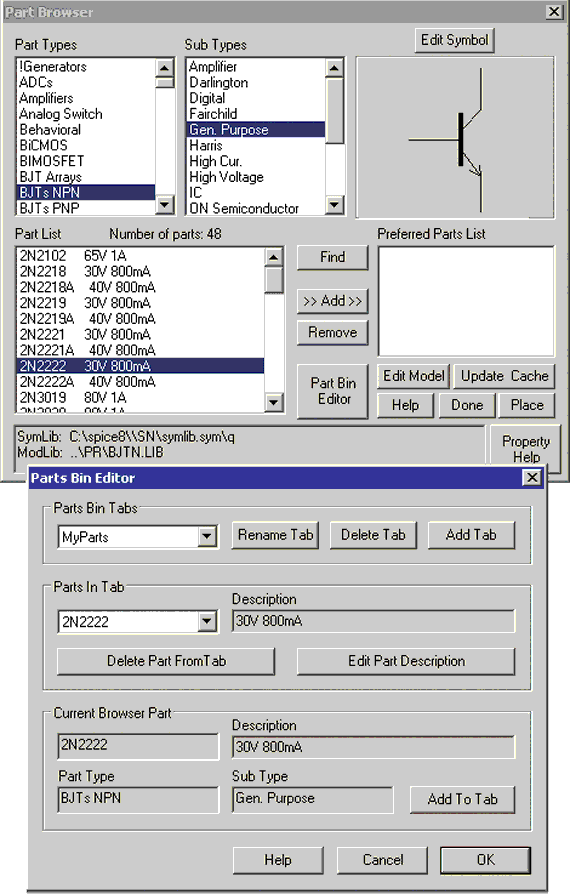
In the previous release a graphical "preferred parts bin" was added that allowed the user to drag and drop parts directly onto the schematic. In this release the user can now create a new Part Bin tab, and add multiple parts to it without having to close and reopen the Parts Bin Editor dialog for each part. When you click on the Part Bin Editor button in the Part Browser, the Parts Bin Editor dialog will appear above or below the Part Browser dialog, based on which side has more open room. Now it is possible to change parts in the Part Browser dialog, and click on the Part Bin Editor button to re-initialize the editor with the currently selected part. This greatly speeds up the process of adding parts to your custom preferred parts bin.

Figure 2:
You are now able to still select parts in the Part Browser while the Parts Bin Editor is up. This saves you from having to close and reopen the Parts Bin Editor every time you want to select another part to add. Just click on the Part Bin Editor button to re-initialize the editor with the currently selected part.

TOP

Crossprobe Thumbnail Graphs

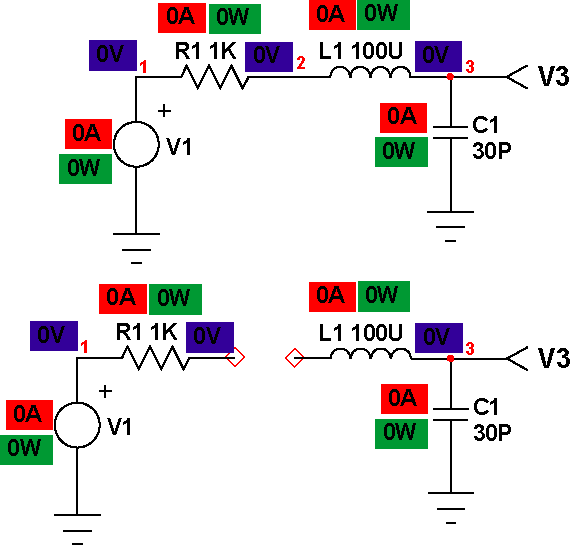
The quality of cross-probe thumbnail graphs displayed on the schematic have been upgraded. These are the small waveform graphs that appear on the drawing when you hold down the <shift> key while cross-probing. The cross-probe cursor will automatically change to the normal cursor when it is over the thumbnail graph. To select the graph, hold down the left mouse button on the thumbnail graphs until the small squares appear in the corners and middle sides. You can now delete the graph (backspace or delete key), drag and drop the graph to another section of the schematic, re-size the graph by moving the small squares, or use the keyboard arrow key to move the graph around by pixels. Note: You can hold down the <shift> key and use the arrow keys to move the entire schematic.

Figure 3:
Display high quality thumbnail graphs directly on the schematic for documentation purposes.

TOP

Monte Carlo Simulation Template

Changes have been made to the Monte Carlo simulation template to make it run significantly faster, and to show the current status of the analysis while the simulation is running. You are now able to see when the data reduction is starting, and which measurement it is currently processing. Also, case runs are now excluded where the simulator was not able to converge to a solution (i.e., run to completion). This prevents histogram and probability graphs in IntuScope from including invalid cases. It also excludes simulation control measurement results that formerly were displayed as"test failed" for including a non-convergent case measurement. Previously you had to ensure that all case runs were able to converge. Now you can ignore an invalid case, or later on ascertain why that specific case run was problematic.

TOP

Results Dialog and Report File

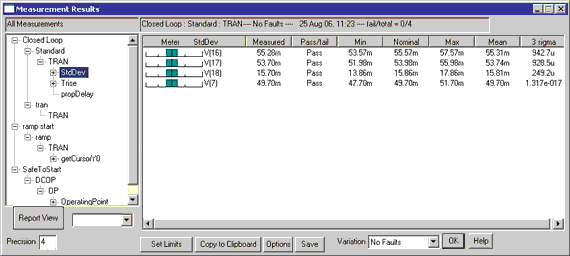
You are now able to stretch horizontally Simulation Control's results dialog so you can see all the measurements at once without scrolling. Previously you had to scroll to view the mean and 3-sigma values. Also, the results dialog only allows you to view one function measurement group or scripted measurement at a time. You are now able to save all measurement results into a text .RPT file so you can view everything at once. Previously, only Test Designer and ICAP/4 Professional had the capability to save report files. Now ICAP/4Windows, ICAP/4 Windows Power Deluxe, and ICAP/4Windows RF Deluxe have this ability. The report files are even more useful since scripted measurements are included instead of only function measurement groups. Also, instead of the columns being a fixed width, the column size changes based on the number of digits you specify to show. This rids the extra spaces between columns.

Figure 4:
Stretch the results dialog horizontally so you can see all the measurements at once without scrolling. Press the "save" button to save all measurements in a .RPT file.

StdDev Closed Loop : Standard : TRAN---- No Faults ---- 25 Aug 06, 12:00 ---- fail/total = 0/4
Parameter Measured P/F Min Nominal Max Mean 3 sigma
|-|-|x|-|-| V(16) 55.28m Pass 53.57m 55.57m 57.57m 55.31m 942.7u
|-|-|x|-|-| V(17) 53.70m Pass 51.98m 53.98m 55.98m 53.74m 928.5u
|-|-|x|-|-| V(18) 15.70m Pass 13.86m 15.86m 17.86m 15.81m 249.2u
|-|-|x|-|-| V(7) 49.70m Pass 47.70m 49.70m 51.70m 49.70m 1.317e-017

Trise Closed Loop : Standard : TRAN---- No Faults ---- 25 Aug 06, 12:00 ---- fail/total = 0/4
Parameter Measured P/F Min Nominal Max Mean 3 sigma
|-|-|x|-|-| V(16) 7.568n Pass 6.868n 7.340n 8.173n 7.496n 199.3p
|-|-|x|-|-| V(17) 7.584n Pass 6.877n 7.357n 8.206n 7.513n 198.6p
|-|-|x|-|-| V(18) 8.207n Pass 7.339n 7.917n 9.053n 8.108n 282.4p
|-|-|x|-|-| V(7) 800.0p Pass 760.0p 800.0p 840.0p 800.0p 0

propDelay Closed Loop : Standard : TRAN---- No Faults ---- 25 Aug 06, 12:00 ---- fail/total = 0/1
Parameter Measured P/F Min Nominal Max Mean 3 sigma
|-|-|x|-|-| propDelay 8.019n Pass 7.000n 8.000n 9.000n 7.996n 79.81p

Figure 5:
View results from your StdDev and Trise function measurement, and the propDelay scripted measurement all at once in the .RPT file.

TOP

Removed Select Limits and Expanded Others

We have removed and expanded select limits in 8.x.11 Build 2817. The ICAP/4 library file name used to be limited to 16 characters but you can now use 64 characters. Also, you could only compile into the part database the first 250kB of each library file, but now there is no limit. This means as many parts as desired can be added to a library file. Finally, IntuScope could only read in a text file with less than 100,000 data points. Now there is no limit as to how many data points IntuScope can read in.

The Sweep simulation template used to be limited to sweeping only one parameter in each of the outer and inner loops. You can now assign multiple parts the same sweep variable and sweep them as a group. For example, you can assign three resistors the sweep variable "Rvary" and have all three resistors change simultaneously.

TOP

More SpiceNet Enhancements

On the right side of the Part Properties dialog is a section you can use to create a label list, and save this list as a template for all new parts of the same type that are subsequently placed on the schematic (i.e., voltage source, resistor, capacitor, etc.). Previously your settings would only apply to the current session and revert back to the default when you restarted the program. Now your label list is persistent across all designs.

By default a list of Parts Statistics and simulation related information is now included at the end of the IsSpice4 .OUT file. This includes the number of iterations for various operations, and simulation time for various analyses. To do this the Simulator Options check box in the Simulation Setup dialog is automatically set if any check boxes in the Simulator Options dialog are checked. By default the ACCT check box is set for new designs.

Simulation programs like PSpice, HSpice, and Matlab are able to read in data points stored in a Common Simulation Data File (CSDF). When the ability to generate a CSDF file was first created in ICAP/4, all vector data was included. Now only vectors that you specify to save are included, thus significantly reducing the file size. If you bring up IsSpice4 Simulation Setup and click on the save... button, the generate CSDF output box must be checked to create a .CSDF file after a simulation is completed. To reduce the amount of vectors saved, you must ensure "save all voltages, all current, and all power" data is unchecked to exclude all subcircuit vectors. To reduce the file size further, bring up simulation control and change the setting to only save" test points" or "nodes + test points." The simulation must be run from outside simulation control to obtain the .CSDF file, since this file can only include vector data from one run.

TOP

IsEd5

Several improvements have been made to IsEd5 to make it even easier to use. For instance, the first document opened is always re-sized to fit the entire main window to give you maximum editing room. If you open another document, then both documents will be re-sized and positioned based on your saved preferences. Newly opened documents will always appear in front of previous opened documents. Previously, the cascade and tile action would reorganize the documents based on their relative position, and the one that currently had focus would be moved to top left. Now cascade and tile action will automatically sort the documents in top-to-bottom and left-to-right sequence, based on order of document opening. You can now save all document sizes and positions including maximum or normal state, plus the default font. Previously only the currently selected document would be affected by a font change. Now when you change the font, not only is the currently selected document affected but any new document you create or open will have your new font settings.

Text drag and drop editing has been added. You can highlight text and drag it to another section of the document.

You are now able to cut append (<Shift>+<Ctrl>+X) and copy append (<Shift>+<Ctrl>+C) the selection to the text already on the clipboard. Copy multiple separate lines to the same clipboard and paste them as a group. You can left mouse click at the beginning of a line to highlight the entire line.

If you highlight text before you do a find or replace, then the highlighted text will be automatically placed in the Find What: field. In the replace dialog you are now able to add tabs to the Find What: field, and add tabs and Line Break into the Replace With: field.

Figure 6: Improved Find and Replace dialogs.

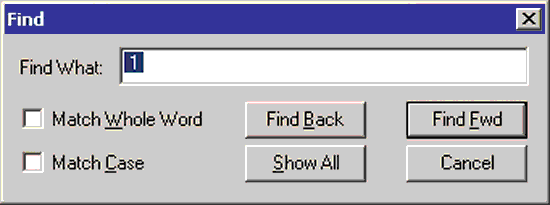
A "Show All" instances button has been added to both the find dialog and toolbar, which will highlight all instances of specified text with MS Windows highlight color. This is extremely useful for quickly seeing all instances of a node or passed parameter. The technique for only seeing node numbers, instead of values that might also include the desired number, is to have a space before and after the number. This means only node 1 will be highlighted and not 1 in 1k. The technique for only seeing passed parameters highlighted instead of all instances 
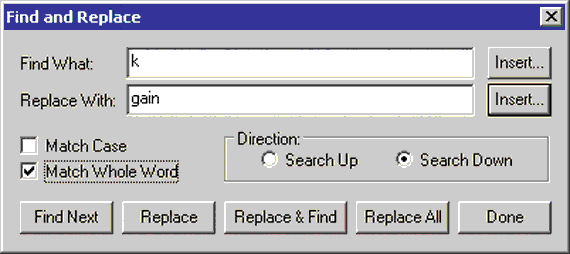
of that letter combination is to check "Match Whole Word" in the find dialog before you click on the"Show Al" button. For example, if your passed parameter is "k" then you don"t want to highlight all instances of the letter "k" but only instances between {} or k=value. To switch document focus or scroll through a long document without losing the highlights use the scrollbar or mouse scroll wheel. Clicking on the document with the left mouse button will cause the highlights to disappear.

Select Included block <ctrl>+B has been added. Place the cursor to the left of a delimiter, which can be any of the following single characters {, (, [, or .subckt, and the logical region including the block is highlighted. This is useful in checking script expressions and netlist subcircuit nesting. Placing the cursor to the left of a closing delimiter ), }, ], or .ends will select the previous block.

TOP

Improved IntuScope

IntuScope has been modified so that if plot x axes are linked, adding a new plot will not unlink them, as long as the new plot"s x axis has the same name, the same units, and is compatible with any log scale on the current x axis.

Hold down the <shift> key and click on the ID in the legend to add or remove waveforms from your selection for cut, copy, and resizing of waveforms. This makes multiple waveform selection much easier because previously you had to click on the ID at the end of each waveform.

TOP

ICAP/4's new Digital Data Viewer

ICAP/4"s "IntuScope" waveform viewing and processing 
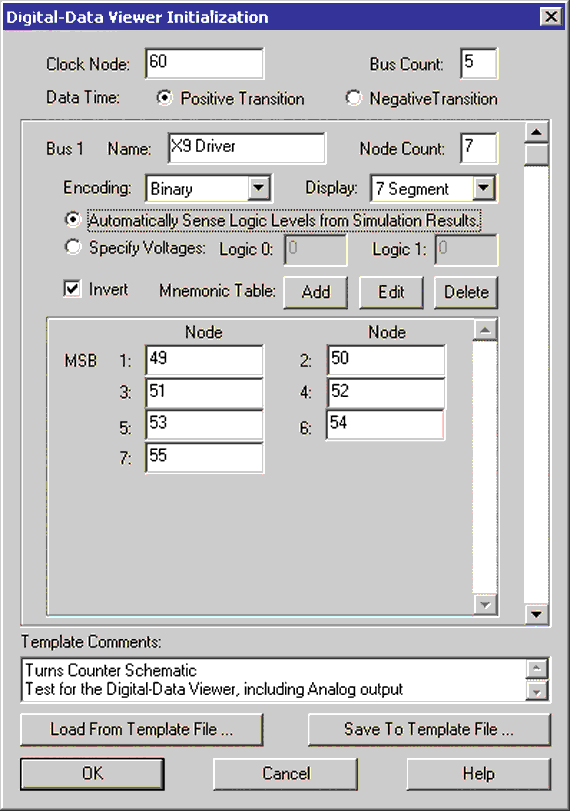
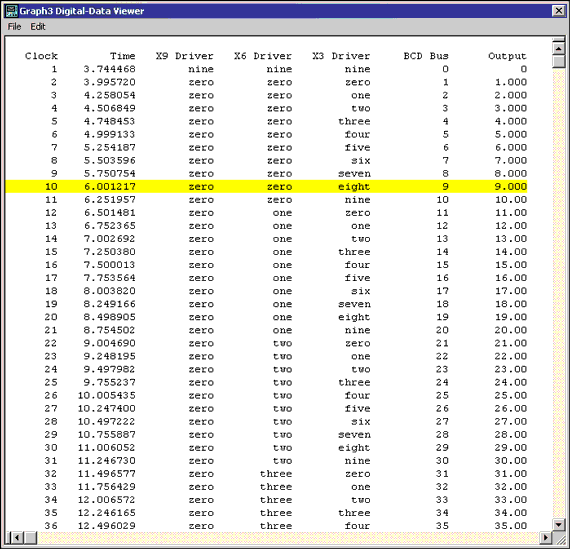
tool now has a new capability. It's called "Digital Data Viewer" or (DDV). DDV makes it possible to view the value of "digital buses" as a function of time. The value of a bus can be prescribed as a single value (i.e., decimal value of 52) that represents the simultaneous binary values of the digital lines that comprise the bus. Previous versions of IntuScope only had the capability to display the waveforms of individual lines. DDV adds much more to this.

An example of the power of DDV can be realized if viewing the input lines (buss) to a 7-segment LED display. Say the bus's binary pattern of 0010111 produces a numerical LED readout of "5." These conditions are hard to correlate when debugging the design since: 1) It takes a concerted effort to select the individual bus lines and simultaneously interpret their waveforms in IntuScope. 2) It's hard to correlate that bus value with the LED"s readout of "5," since the numeral doesn"t "light up" on the schematic. 3) As the inputs change, the process repeats and requires much time to constantly reiterate the waveform-to-LED output decoding process. These challenges can also holds true in viewing bus waveforms with a gate-level digital simulator.. Though the waveform viewer often provides numerical values for buses in conjunction with say a system clock line, it typically doesn"t correlate the data in tabular form or allow for mnemonic specification of the bus values.

But DDV does provide tabular display of bus values. It also includes the capability to display bus contents using a mnemonic value (i.e., "system activate" or "clock enabled") rather than a potentially less-meaningful numeric value. This can be advantageous when validating the operation of digital buses, and save time in the debug or testing cycle.

A cursory explanation of DDV was just covered. As previously touched on, DDV takes the value of a bus in whatever format prescribed by the user (i.e., binary, decimal, mnemonic), and in a convenient tabular format displays that data. Further, this is systematically displayed in correlation to the timing of any signal in IntuScope (i.e., rising edges of the system clock).

For IntuScope to provide input bus data and corresponding output in mnemonic form, DDV provides a means to fill in a lookup table that defines input and output numeric and mnemonic values (e.g., the LED"s input bus one and zero data, with a corresponding output digit). The process takes a bit of time, but pays off in spades during debug cycles where inputs and resulting outputs constantly change.

Example Schematic:
The example schematic that will be used in this discussion is the TurnsCounter.DWG, which is shown below. This schematic contains four digital buses, which will be viewed by the Digital-Data Viewer. The first three consist of the seven output nodes for each of the three CD4511B LCD display drivers: Sub-circuits X2, X5, and X8. These in turn provide inputs to the three 7-segment LED displays. The 12 input lines to the DAC3 "X10" comprise the fourth digital bus.

Figure 7: TurnsCounter Schematic

Initialization:
To initialize the digital-data viewer, it is necessary to specify the properties of the buses, and the digital clock. This is done through the initialization dialog, which is shown in Figures 8 below. Initializing the Digital Viewer is done from IntuScope"s Actions pulldown. The information was filled in to set up the truth table data for the buses feeding the 7-segment displays, and the corresponding output data (numbers), and similarly for the DAC.

Figure 8: Completed Initialization Dialog

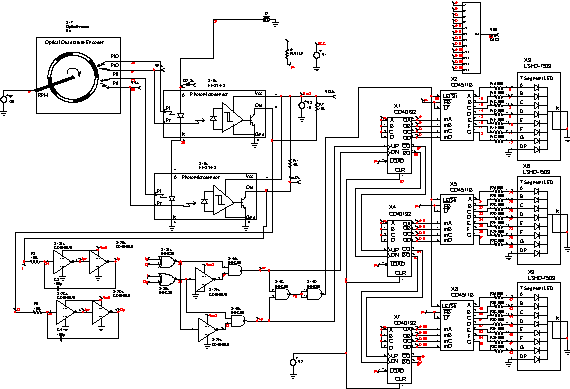
Clock: The clock node is node 60 on the drawing, so 60 is entered in the Clock Node field of the dialog. In this schematic, the time of interest is the positive edge of the clock pulse, so the Data Time: Positive Transition radio button is selected.

Bus Data: As described above, this schematic contains four digital buses that we wish to view. However, we would like to also view one analog value for comparison with the buses, so a 5 is entered in the Bus Count field. As soon as you enter a bus count grater than 1, the scroll bar on the right side of the dialog will become active so that multiple bus definitions can be entered.

7-Segment Driver Busses: The first bus was named "X9 Driver" with 7 nodes. As soon as the bus Node Count is entered, the appropriate number of node-definition fields are displayed to define the nodes. In the case of the first three buses, the input data is encoded in binary form, so "Binary" Encoding is selected from the drop-down list. The Display drop-down is set at "Decimal" for now. Next, we are interested in the nodes of the bus that remain low, rather than those that are high, so the Invert check box is selected.

The schematic node numbers for each of the 7-segment driver buses are entered in node-definition fields. The appropriate node numbers in the order of the drivers in the schematic are entered as shown below.

X9 Driver X6 Driver X3 Driver
49 31 19
50 32 15
51 33 14
52 34 13
53 35 16
54 36 17
55 37 18

BCD Bus: The fourth bus is one that takes binary-coded decimal data from the inputs to the X2, X5 and X8 drivers, and sends it to the DAC "X10." It's entitled the "BCD Bus." In this case there are 12 bus nodes, and "BCD" is selected in the Encoding drop-down list. The appropriate Display setting is "Decimal." The Invert check box was not checked. The following node names were entered in the dialog:

BCD Bus
D100 (Most Significant Bit)
C100
B100
A100
D10
C10
B10
A10
D1
C1
B1
A1

Analog Value: Node 65 in the schematic represents the output of X10, the DAC3 digital-to-analog converter. While this one node obviously doesn't constitute a bus, it would be useful to be able to compare its value with the values of the buses; the Digital Viewer provides a way to do that. For the fifth "bus," "Output" is entered for the bus Name. The Node Count is left set at 1, and 65 is entered in the lone Node field. Since the Node Count is 1, an additional "Analog"; mode is available in the Display drop-down list. When selected, the Encoding mode drop-down list, and several other items, will be grayed out because they are not applicable to viewing the analog value of a single node.

Mnemonic Table Definition Dialog:
One of the 7-segment buses first was made active in the Digital-Data Viewer Initialization dialog. The Mnemonic Table Add button was clicked, displaying a new dialog that contains a table listing 128 (i.e. 27) numbers that represent each possible value of a seven-node bus. The following mnemonic values were then entered for each of the ten meaningful input bus values for this specific device.

Bus Value (in decimal) Mnemonic (LED numeral)
48 one
51 four
91 five
95 six
109 two
112 seven
121 three
123 nine
126 zero
127 eight

Once the "7 Segment" lookup table was defined, each of the three 7-segment buses had its display format selection changed to use it.

Mnemonic Edit and Delete Buttons: The Digital Data Viewer Initialization dialog also contains buttons for conveniently editing and deleting existing mnemonic tables.

Template Definition Files:
Since a significant amount of effort is required to define all the information required to use the DDV for a given schematic, a mechanism is provided to allow saving the data to and reloading it from a "template" file. After completing the definition of all four busses and the mnemonic lookup table, plus any desired comments to be saved with the template, the "Save to Template File" button was selected. By default, template files are given a .DDT extension. However, they are actually ASCII text files, which can be read and edited using any text editor. Any time the template is reloaded, it can be modified if desired, using the same initialization dialog, and re-saved to the same or a different file name.

Viewer Window:
Once everything was correctly entered, the OK button was clicked. This caused the clock vector to be plotted as a function of time in IntuScope"s main plot window,. It also opened a "digital-data viewer" window, listing the time of each clock pulse and the value of each bus at that time. An example is shown below. Each line in the viewer window shows the time of each trigger event of the system"s clock node and the state of each bus at that time. Note a one-clock cycle offset between the value of the BCD Bus and the value of the input buses to the LED displays. This is caused by the time delay between the input and output of the display drivers.

The final "Output" column in the digital-data viewer window represents the analog voltage of Node 65 at the same times as the digital bus values. Note that since it is the output of X10, its values should, and do, agree with the values of the X10 input, which we named "BCD Bus."

Linkage to the Clock Trace:
If you click on a line in the Digital-Data Viewer, that line will be highlighted. Simultaneously, the #1 cursor in Plot 1 of the main waveform window automatically moves to the corresponding position on the clock trace. Similarly, if Cursor 1 is dragged to a different position between the beginning and end of the trace, the corresponding line in the viewer window is then highlighted, and scrolled into view if necessary.

As with any other IntuScope plot, additional traces can be added, if desired, to allow comparisons between the clock, the busses, and any other portions of the schematic.

Figure 9: Digital-Data Viewer Window

Other Features:
Clicking on the DDV window"s close box hides the window, rather than destroying it, so it can be quickly brought back to view. The DDV window is saved along with other windows when selecting Save from the IntuScope main File menu. Further, the contents of the DDV window can also be saved as a text file or sent to a printer. Selected lines, together with the column-header line, can be copied to the clipboard.
A DDV will be the saved under a version number and automatically modified to allow it to be saved as part of the .GRF file, and restored when the file is reloaded. The window can also be printed from IntuScope's File menu.

For more information on Intusoft's new DDV, email techsupport@intusoft.com

TOP