In this analysis (actual EVA.SCP file), we change each parameter value to its extreme
tolerance value such that the scalar measurements are maximized.
Only parameters that have tolerances are altered. The extreme
value for each tolerance with respect to a measurement is based
on the sign of the previously run sensitivity analysis. The simulation
is then run with those new parameter values that should maximize
the scalar measurement value and the result for that measurement
is saved in the "evahi" plot. The process is repeated
for each measurement and when all the simulations are finished,
the measurements are printed to the IsSpice4 output file in a
format that can be read back in by SpiceNet. Additionally, the
output file contains a summary report for your records. If you
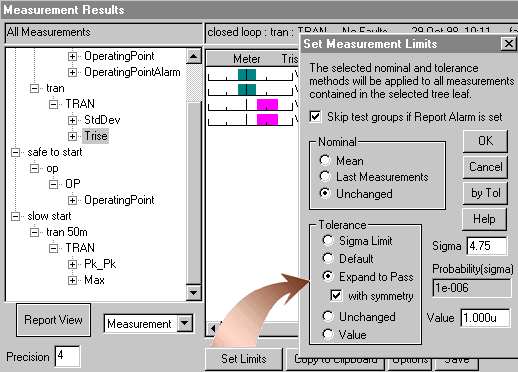
don't want make an evalo analysis, you can set the measurement
min/max test limits by expanding the measurements to pass with
symmetry in the Results dialog; as shown below.
The extreme value in this analysis refers
to the parameters, not the resultant measurements. For most
moderately complex circuits, the extreme value of the resultant
measurement occurs when some of the parameters are at an intermediate
rather than an extreme value. However, we usually find that
EVA results produce wider measurement test limits than Monte
Carlo — making it a worthwhile investment. Finding the true
extreme value of the resulting measurements requires solution
of a multi-parameter optimization problem. This becomes nearly
impossible for larger circuits because the number of simulations
grows as the product of parameters times the vectors. The EVA
in this script runs an analysis for
each toleranced parameter to get perturbation results and another
for each measurement to get the final results.